


Pilot Project to create a 'Global Water Quality Analysis and Service Platform' –
GlobeWQ Pilotprojekt Analyse- und Service-Plattform Globale Wasserqualität
Globe WQ Cases
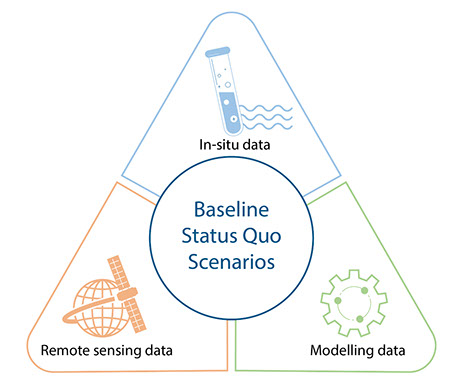
Overview on the triangulation approach and the GlobeWQ Use Cases
Impact of the COVID-19 lockdown on surface water quality- application of the triangulation approach
Overview on the triangulation approach and the GlobeWQ Use Cases
Estimated reading time 1 minute 30 seconds
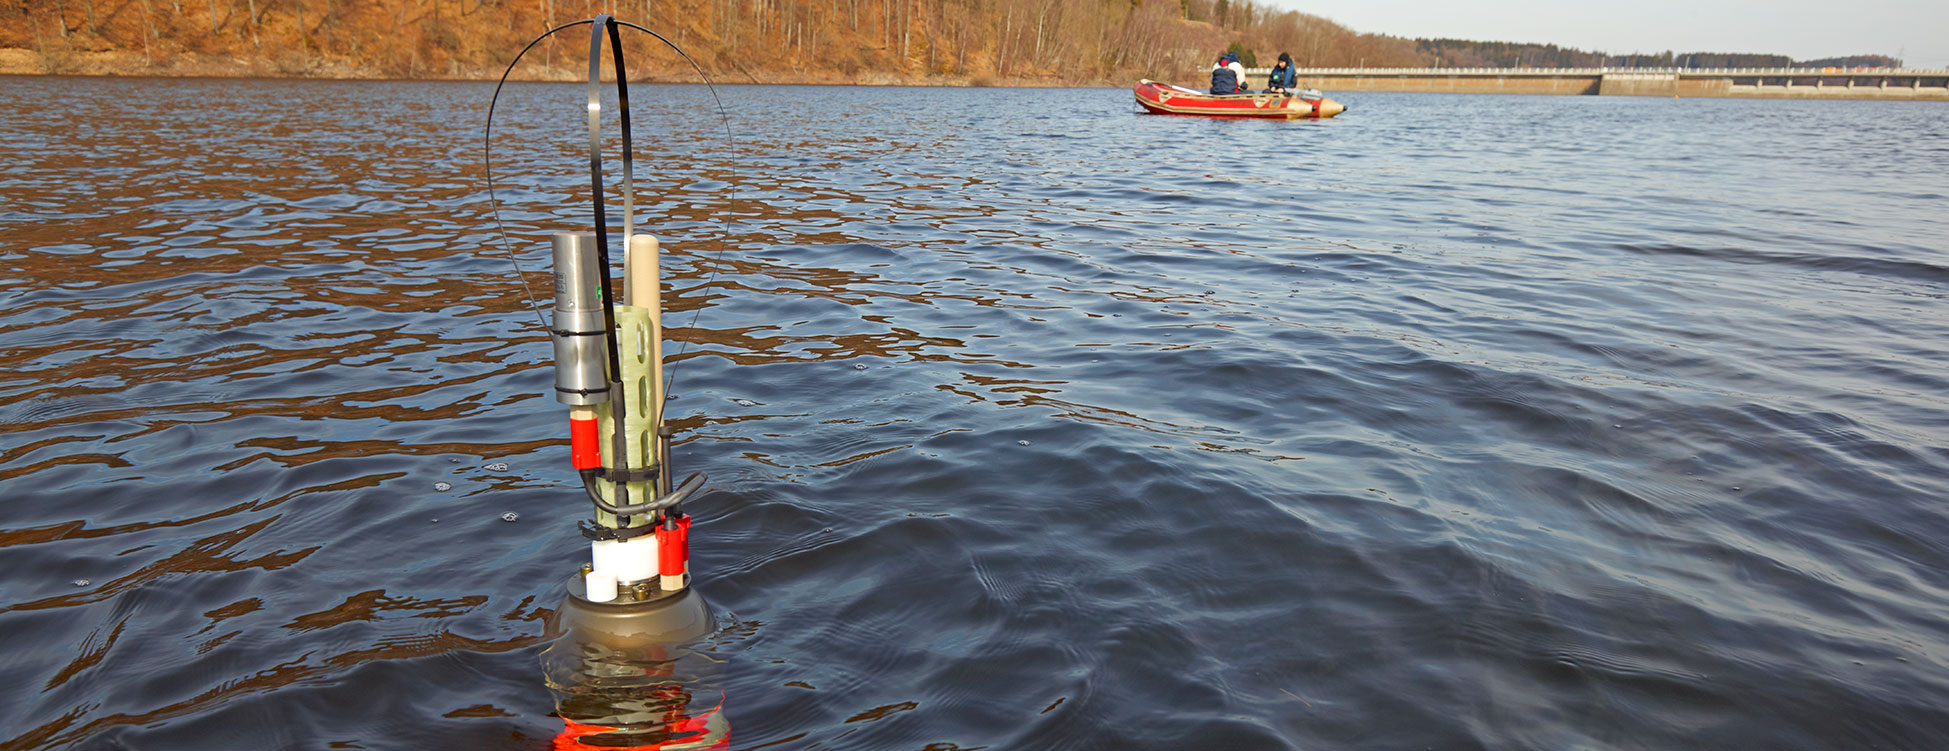
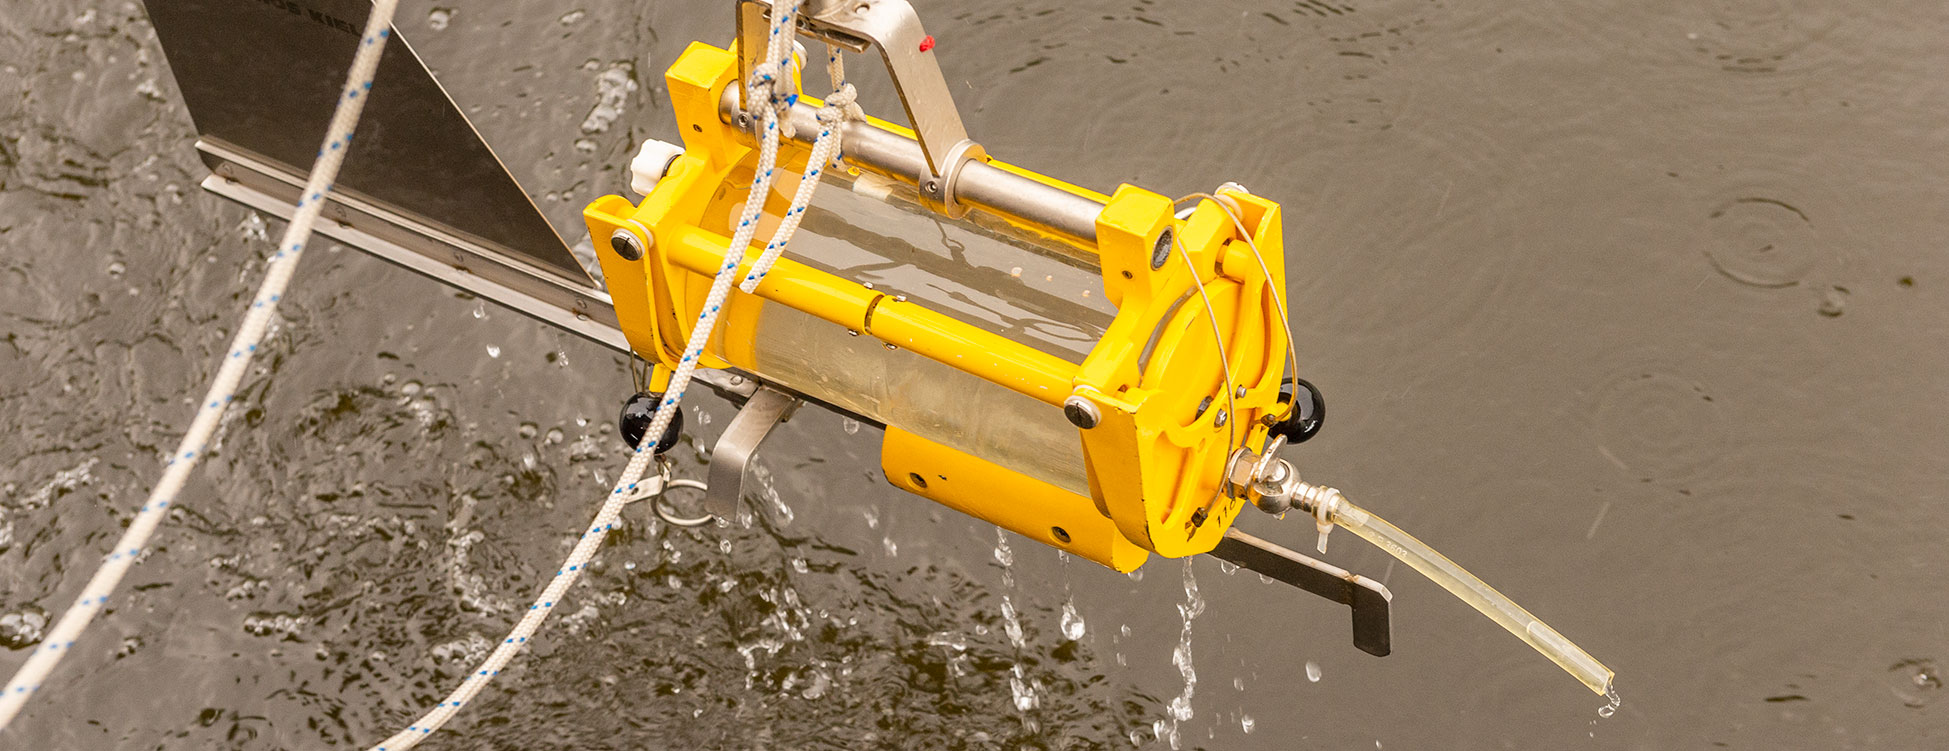
The GlobeWQ project aims at providing robust and timely water quality information with improved spatial coverage by combining data from in-situ observations (sensor data and water samples that are subsequently analyzed in a laboratory), remote sensing and water quality modelling. Each of the methods has its merits; while in-situ observations cover a wide range of parameters and are often perceived as most reliable, satellite imagery is available virtually everywhere, but only a limited range of water quality parameters can be derived. Models for waterflow and water quality are the only tools that can be used for future predictions and the analysis of scenarios. In the GlobeWQ project we combine information from different sources by applying the so called triangulation approach.
GlobeWQ provides global water quality information products based on the result of the WorldQual model and by incorporating in-situ data from GEMStat water quality database. The globally available information is regionally reinforced for the Use Cases with data products from remote sensing (EOMAP, eoWaterQuality) and additional in-situ data.
The GlobeWQ Use Cases ideally arise from a co-design process so that data products are tailored towards the user needs. An example is the Lake Victoria Use Case. This Use Case is part of the African Use Cases of the World Water Quality Alliance. GlobeWQ specifically provides timely water quality information for Lake Victoria and its tributaries such as Chlorophyll-a from remote sensing and phosphorus loadings from tributary catchments derived from the WorldQual Model. GlobeWQ tests and demonstrates the triangulation approach for different aspects of water quality. For instance, GlobeWQ has looked at impacts of the COVID-19 lockdown on surface water quality by combining in-situ observation.
Participatory management options
Conceptual sketch of the triangulation approach for water quality
© GlobeWQ project and Andrea Wessler (ICWRGC)
The Lake Victoria Use Case
Estimated reading time: 5 minutes
A Lake under pressure
The Lake Victoria Use Case is one of the three African Use Cases that was piloted by the World Water Quality Alliance to demonstrate the capabilities of current water quality information services. The Lake Victoria has also been the first demonstration case for our GlobeWQ platform.
Lake Victoria is Africa’s largest lake and the second largest freshwater body in the world by surface area after Lake Superior. It contributes substantially to the economies and livelihoods of the Riparian States (Kenya, Tanzania, Uganda). Particularly, fishery is an important economic sector for the entire region (Njiru et al. 2018). Despite its importance, lake water quality is under pressure through oil spills, discharge of waste water, inputs of solid waste and diffuse nutrient inputs (Hecky et al. 2010; Njiru et al. 2014; Nyamweya et al. 2020). High nutrient loadings are one of the key factors causing harmful algal blooms (Stager et al. 2009; Hecky et al. 2010). Algal blooms threaten fish population directly when resulting in low oxygen conditions (Ochumba 1990; Hecky et al. 1994; Njiru et al. 2019). Moreover, cyanobacteria-producing harmful algal blooms (cyanoHABs), can lead to the enrichment of microcystin in fish, which can in high concentration pose risks to human health (Mchau et al. 2019; Roegner et al. 2020).
Through the WWQA stakeholder workshops for Lake Victoria it has been recognized that there is the need to better observe the occurrence of algal blooms. Monitoring algal blooms in Lake Victoria requires a multi-method approach due to the large size of the lake, its transboundary nature, and data collection challenges. Better information is needed to develop strategies to reduce point and diffuse nutrient inputs.
Applying the triangulation approach for Lake Victoria
In-situ observations at Lake Victoria are available from the GEMStat database. While these observations partially provide insight into the long term history of water quality, the monitoring interval is often irregular and the information is rarely up to date. Harmful algal blooms can develop over hours or days and thus information is needed with short lead time and a lake-wide spatial coverage. To tackle this information gap we provide water quality information based on satellite remote sensing for optical lake water quality including Chlorophyll-a, Temperature and the Harmful algal bloom (HAB) indicator on the GlobeWQ platform. The data is updated for each satellite overfly of the Copernicus Satellites Sentinel 2a and 2b. The water quality model WorldQual is applied to provide long-term information on the loadings of Phosphorus, Biological Oxygen demand, Faecal coliform bacteria and Total suspended solids from the tributary catchments of Lake Victoria between 1990 and 2017.
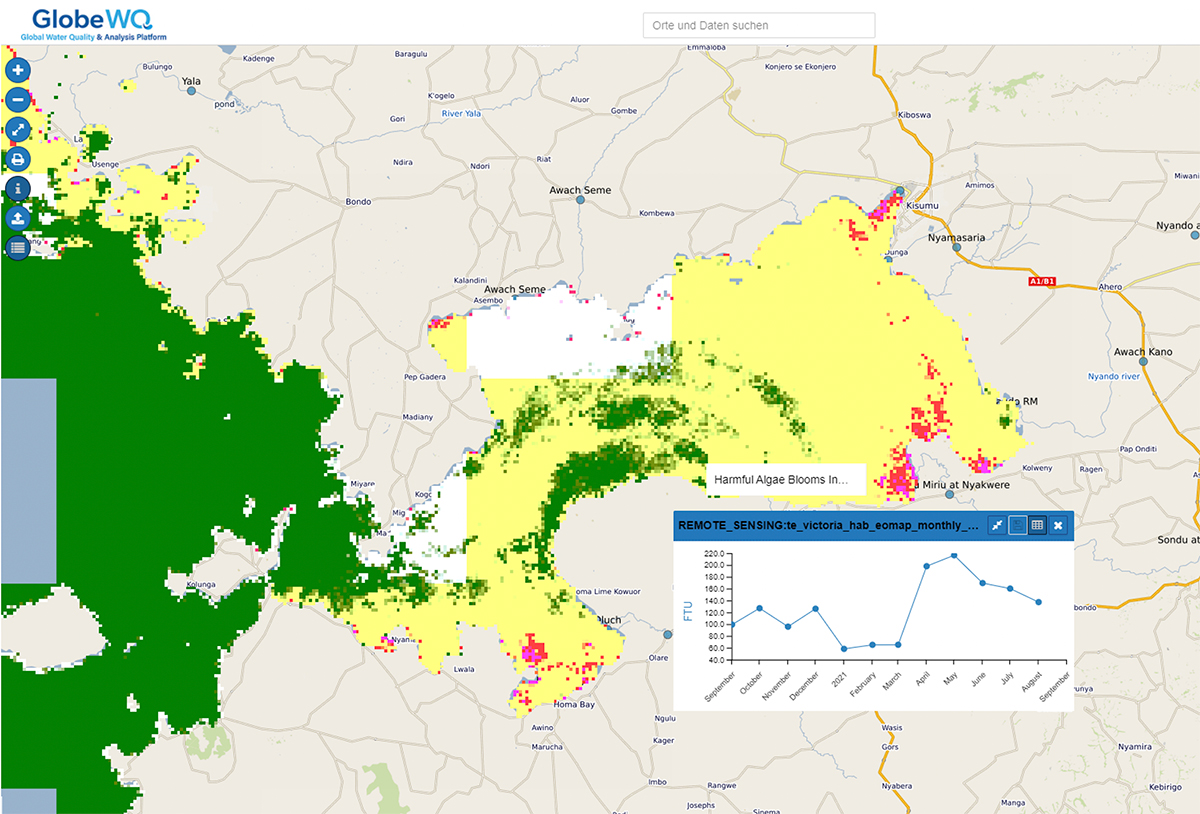
Water Quality information from satellite remote sensing for the Winam Gulf in the North Eastern part of Lake Victoria. Yellow and red colors indicate a high level of the HAB indicator. The time chart depicts the HAB an annual time series between Sept. 2020 and Sept. 2021 from a virtual station which can be activated by clicking on the map. (Data credit: EOMAP).
Identifying water quality hot spots
Modelled loadings of Total Phosphorus reveal that five of the tributary catchments to Lake Victoria contribute to more than 70% of the annual loadings. As revealed by remote sensing information, the Winam Gulf is susceptible to high Chlorophyll-a concentrations on the one hand because of its limited water exchange with the main lake and on the other hand because of the nutrient loadings received from the Nyando and Sondu catchments.
Modelled total phosphorus loading and its sources for the tributary catchments of Lake Victoria for 2008-2010 (WorldQual Model, University of Bochum)
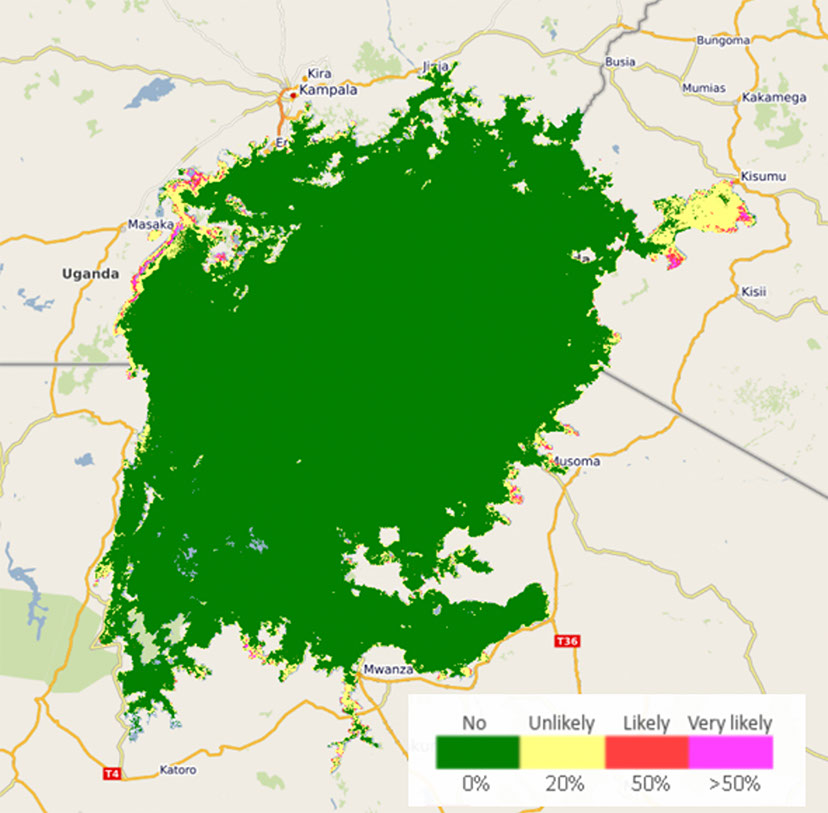 HAB Indicator (Monthly average, Dec. 2020) derived from remote sensing, revealing water quality hot spots in the Winam Gulf as well as at the Western and Southern coastlines (Data credit: EOMAP)
An analysis of in situ data over the last decades from the GEMStat database revealed long-term patterns of several water quality parameters. There is no general trend across different parameters. Electrical conductivity and Nitrate concentrations significantly increased between the periods of 2000–2006 and 2011-2016. In contrast, Chlorophyll-a and Total Phosphorus decreased.
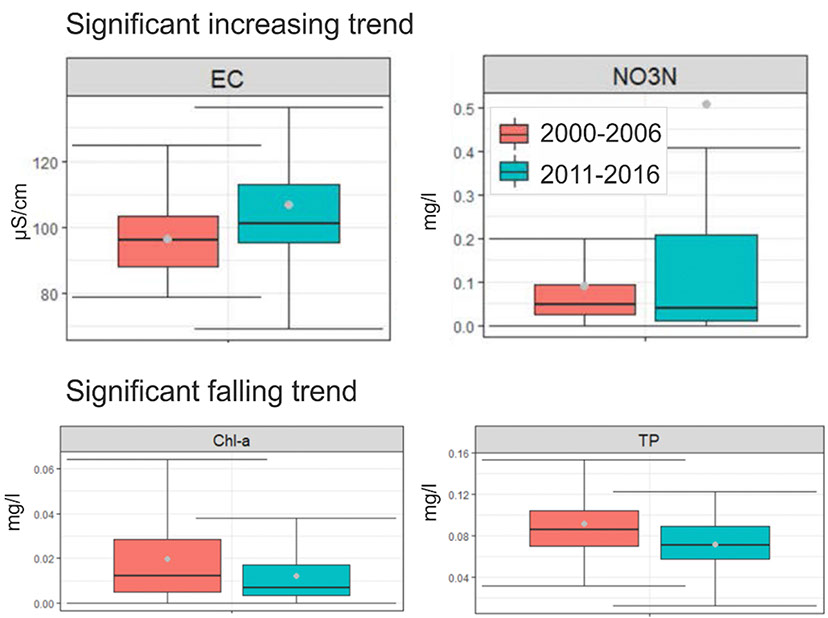 Changes of the water quality parameters between 2000-2006 and 2011-2016. Grey dots depict the mean values (EC: Electrical conductivity; NO3N: Nitrate-N; Chl-a: Chlorophyll-a; TP: Total Phosphorus)
Nutrients in the sediment and paleolimnology
Lake Victoria has been under eutrophication for decades, which implies that there are a lot of nutrients stored in the sediment. These sediment nutrients also contribute to the nutrient loading especially in shallow bays where the sediment is susceptible to wind induced resuspension. We are currently analysing sediment samples from Lake Victoria to determine the concentration of nutrients in the lake sediments (shallow and deep waters). Looking into sediments of different ages (paleolimnological analysis) we also hope to gain a better understanding of the history of nutrient inputs and thus the trends in lake eutrophication, which can then be better connected to its drivers. This historical information will help closing gaps in the currently available long-term in-situ data.
Outlook
We are confident that already now, in the prototype stage, the GlobeWQ platform will help to get improved and especially timely information on eutrophication related water quality parameters. In the future, we hope to further strengthen the database particularly for in-situ data and to expand the provided information offering to other aspects of water quality such as scenarios on possible future development.
References
Hecky, R. E. and others 1994. Deoxygenation of the deep water of Lake Victoria, East Africa. Limnol. Oceanogr. 39: 1476-1481. doi:10.4319/lo.1994.39.6.1476
Hecky, R. E., R. Mugidde, P. S. Ramlal, M. R. Talbot, and G. W. Kling. 2010. Multiple stressors cause rapid ecosystem change in Lake Victoria. Freshwat. Biol. 55: 19-42. doi:10.1111/j.1365-2427.2009.02374.x
Mchau, G. J., E. Makule, R. Machunda, Y. Y. Gong, and M. Kimanya. 2019. Harmful algal bloom and associated health risks among users of Lake Victoria freshwater: Ukerewe Island, Tanzania. J. Water Health 17: 826-836. doi:10.2166/wh.2019.083
Njiru, J., M. Van Der Knaap, R. Kundu, and C. Nyamweya. 2018. Lake Victoria fisheries: Outlook and management. Lakes & Reservoirs: Science, Policy and Management for Sustainable Use 23: 152-162. doi:https://doi.org/10.1111/lre.12220
Njiru, J. M., C. M. Aura, and J. K. Okechi. 2019. Cage fish culture in Lake Victoria: A boon or a disaster in waiting? Fish. Manage. Ecol. 26: 426-434. doi:https://doi.org/10.1111/fme.12283
Njiru, M., M. Van Der Knaap, A. Taabu-Munyaho, C. S. Nyamweya, R. J. Kayanda, and B. E. Marshall. 2014. Management of Lake Victoria fishery: Are we looking for easy solutions? Aquat. Ecosyst. Health Manage. 17: 70-79. doi:10.1080/14634988.2014.881220
Nyamweya, C. S. and others 2020. A century of drastic change: Human-induced changes of Lake Victoria fisheries and ecology. Fisheries Research 230: 105564. doi:https://doi.org/10.1016/j.fishres.2020.105564
Ochumba, P. B. O. 1990. Massive fish kills within the Nyanza Gulf of Lake Victoria, Kenya. Hydrobiologia 208: 93-99. doi:10.1007/bf00008448
Roegner, A. and others 2020. Harmful Algal Blooms Threaten the Health of Peri-Urban Fisher Communities: A Case Study in Kisumu Bay, Lake Victoria, Kenya. Exposure and Health 12: 835-848. doi:10.1007/s12403-019-00342-8
Stager, J. C., R. E. Hecky, D. Grzesik, B. F. Cumming, and H. Kling. 2009. Diatom evidence for the timing and causes of eutrophication in Lake Victoria, East Africa. Hydrobiologia 636: 463-478. doi:10.1007/s10750-009-9974-7
Impact of the COVID-19 lockdown on surface water quality- application of the triangulation approach
Estimated reading time: 8 minutes
The lockdowns of large parts of the daily life as response to the COVID-19 pandemic have substantially reduced human mobility and economic activity at global scale (Diffenbaugh et al. 2020). Immediate effects on daily CO2 emission (Le Quéré et al. 2020) and reduced air pollution (Bao and Zhan 2020, He et al. 2020, Venter et al. 2020) have been observed. For example, in the northern Indian state of Punjab the Himalayan mountain range became visible from more than 150 km away for the first time in decades (CNN, 2020). Surface water quality has also been altered by the lockdown, but the effects seem to vary by location. At the Ganga in India the lockdown period coincided with unusually high rainfall and discharges, influencing the water quality and hampering the detection of the lockdown influence. (Dutta et al. 2020). Another study at the Ganga (Muduli et al. 2020) applied satellite remote sensing to analyze for Chlorophyll-a, chromophoric dissolved organic matter (CDOM), and total suspended matter (TSM). The results revealed that due to the lockdown, the water quality of the Ganga partially improved but changes were region specific and no general improvement has been observed. At the Gomti river- a tributary to the Ganga in-situ monitoring data of dissolved oxygen, biological oxygen demand, and total coliform levels was used to assess pre-, lockdown and post lockdown water quality (Khan et al. 2021). At more than two thirds of the sites (69%) the water quality was worse during and post lockdown than for the pre lockdown observations.
Timely assessment facilitated by timely data
The timely assessment of water quality based on in-situ data has been possible for the Ganga and the Gomti rivers because of the availability of monthly in-situ data in the Indian state of Uttar Pradesh and the Indian realtime water quality monitoring system of the Central Pollution Control Board (CPCB). Also satellite images which are available with an overflight interval of a couple of days were used to derive water quality information. The most robust approach, however, would likely be the combination of different data sources.
The GlobeWQ Wuhan Use Case
Wuhan and the Hubei province the first region worldwide to experience an official lockdown of industry and public life (from Jan. 23rd 2020 to Apr. 8 2020). To demonstrate how a combination of methods can be used to gain a robust insight into water quality changes even without access to in-situ measurements we picked the Han River which crosses the city of Wuhan (China) and flows into the Yangtze.
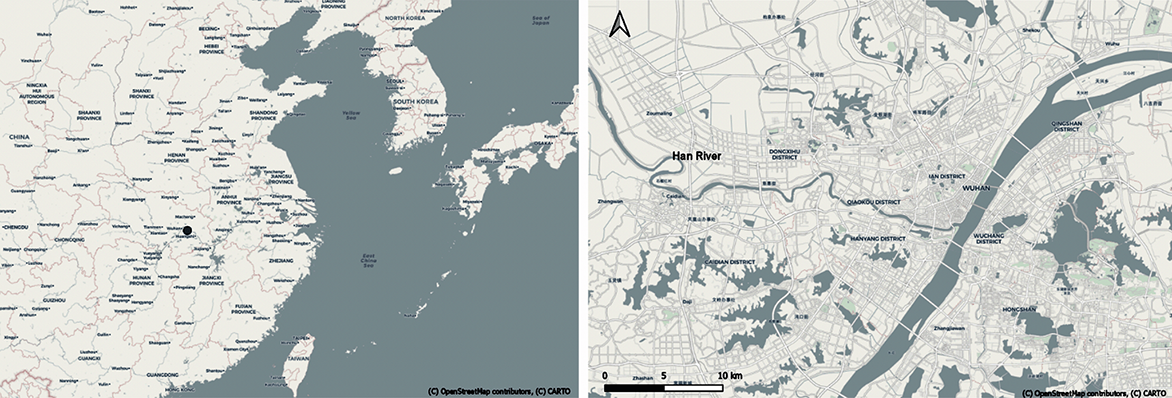
Location of the the city of Wuhan and the Han River
The triangulation approach applied
The analysis of surface water quality comprised three major steps:
- Comparison of the discharge conditions prior and during the lockdown as discharge can substantially influence water quality and thus masking effects of the lockdown
- Analysis of Sentinel-2 and Landsat-8 satellite data for turbidity during the lockdown in 2020 and during the same time period in previous years (2017-2019).
- Analysis of in-situ data from automated sensor data
- Applying a water quality model with scenario simulations of total suspended solids and total phosphorus (TP) where the manufacturing sector as source has been turned off.
Streamflow conditions
As a first step of the analysis we tested if the hydrologic conditions during the lockdown period were different from normal conditions of the same period of the year. For that, the hydrologic model mHM was applied. The long-term discharge simulation confirmed that the discharge conditions have not been exceptional during the lockdown period but tended to be higher than in the previous year.
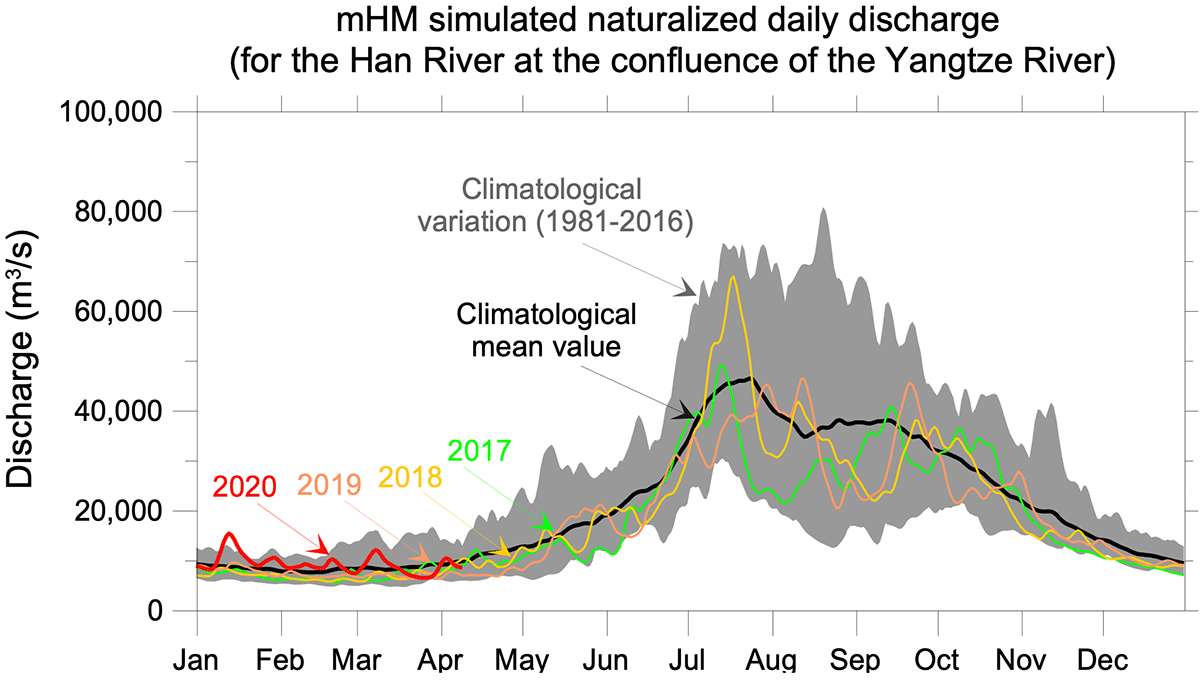 Historical discharge at the Han River compared to 2020
Remote sensing
Turbidity has been mostly reduced during the lockdown in 2020 compared to the same time of the year in the years 2017-2019. Discharge conditions were not exceptional and tended to be even higher than in the previous years which would suggest an increased turbidity. The discharge simulation corroborates the assertion that the reduced turbidity may indeed be an effect of the lockdown and not an artefact driven by hydrological conditions. However, it remains unresolved if the reduction in turbidity is caused by reduced inputs or by the reduction of navigation.
 Turbidity observed from satellite images at the Han River in the City of Wuhan
In-situ data
We analyzed in-situ data obtained from the Chinese National Surface Water Quality Release System for the Han River at the Zongguan monitoring station. For 2020 the in-situ monitoring data was available in 4 hourly resolution. In-situ data was available from 2011-2018 in weekly to bi-weekly resolution. Water quality parameters consistently available for all the years were NH3-N, Dissolved Oxygen and pH. The data is based on water quality probes.
Overall the concentrations of the in-situ parameters were similar during the lockdown period to those observations from the previous years both in terms of absolute values but also in the temporal behaviour. For example, dissolved oxygen concentrations decline consistently in spring each year likely as a result of the seasonal temperature increase in spring.
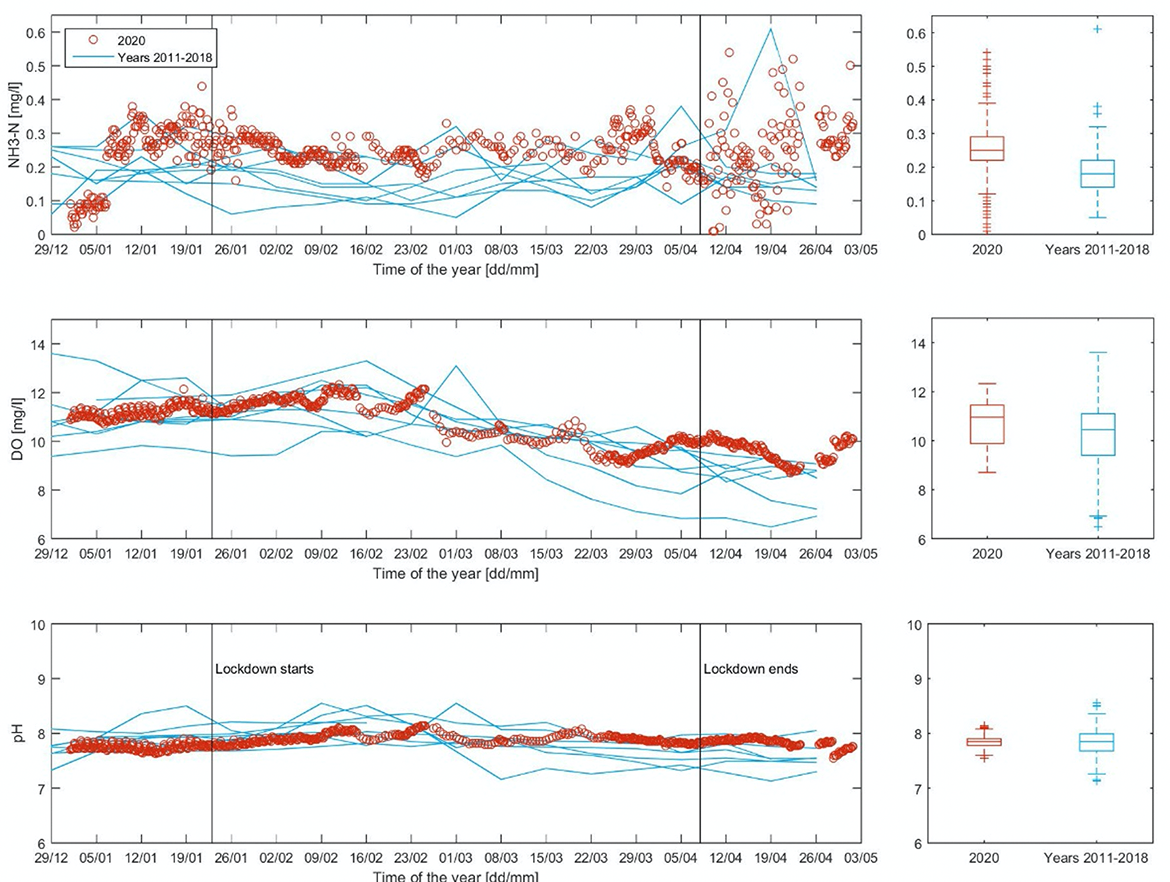
In-situ data for the Han river (Zongguan Station, Wuhan) for ammonia-N (NH3-N), dissolved oxygen (DO) and pH
Water quality modelling- looking into the Han River catchment
While remote sensing and in-situ data provided a local insight into water quality changes, the model WorldQual was employed to simulate scenarios of TDS and TP. It was assumed that sources related to the manufacturing industry are completely shut down in the Han River basin downstream of the Danjiangkou dam.
This scenario suggests a reduction of TDS concentration by ~27 mg/l (81 NTU) in the Han River in the City of Wuhan compared to non-lockdown conditions. This exceeds the reduction of turbidity that has been observed locally by far as here the maximum decrease was only around 1 NTU (1mg/l TDS is equivalent to 3 NTU).
A second modelled water quality parameter was TP. TP loadings reduced by up to 44% as a result of the lockdown (i.e., stopping wastewater generation and return flow to the river) in the areas close to Wuhan and around the city of Dengzhou (northeast) , as the manufacturing industries account for about 36% of the total TP load.
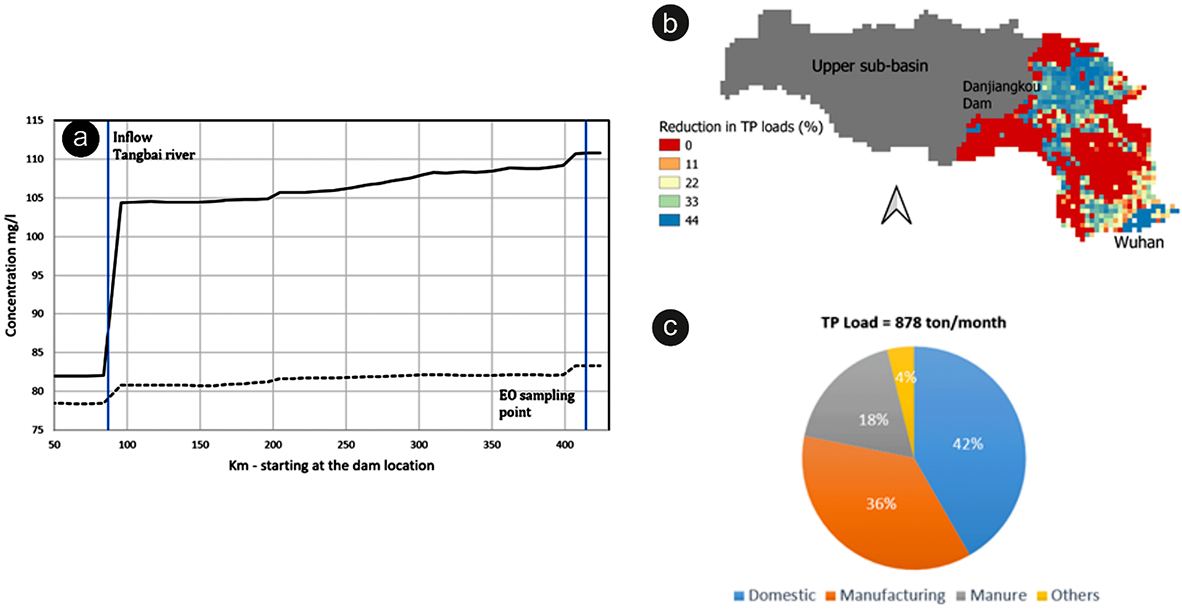
(a) Simulated longitudinal TDS profiles of the Han River between the Danjiankou dam and the confluence with the Yangtze River. Solid line: normal conditions, dashed line: lockdown period scenario with industrial point sources turned off.,
(b) Spatial pattern of the reduction of total phosphorus loading in the Han River subcatchment between Danjiankou dam and the confluence with the Yangtze River by turning off the manufacturing sector.
(c) Contributing sectors to the total phosphorus load in the Han River catchment.
Putting it together
In the Wuhan Use Case we applied a top down approach. We tested how much information can be gathered by making use of data that is out there and by combining it in the light of the triangulation approach. The different information sources yielded different messages. Turning off the industrial point sources in the modelling suggests an immediate improvement of water quality for suspended solids. This was also observed by analysing satellite images for changes in turbidity but not as drastic as the model scenario would suggest. Other water quality parameters such as dissolved oxygen remained unaffected.
Our demonstration case reveals that the provision of data alone does not automatically yield to insight. By aggregating the data to information products and setting it into a catchment context, a more robust and differentiated picture of the situation can be drawn.
Rapid changes of water quality need timely data. It was surprising how much in-situ data is actually available online but it is fragmented across regional and national databases. Remote sensing of water quality provides additional, globally available water quality information and should also be included in water quality analysis as a common tool.
References
Bao, R., & Zhang, A. (2020). Does lockdown reduce air pollution? Evidence from 44 cities in northern China. Science of The Total Environment, 731, 139052. https://doi.org/10.1016/j.scitotenv.2020.139052
CNN. (2020). People in India can see the Himalayas for the first time in “decades,” as the lockdown eases air pollution. Retrieved September 5, 2021, from https://edition.cnn.com/travel/article/himalayas-visible-lockdown-india-scli-intl/index.html
Diffenbaugh, N. S., Field, C. B., Appel, E. A., Azevedo, I. L., Baldocchi, D. D., Burke, M., et al. (2020). The COVID-19 lockdowns: a window into the Earth System. Nature Reviews Earth & Environment, 1(9), 470–481. https://doi.org/10.1038/s43017-020-0079-1
Dutta, V., Dubey, D., & Kumar, S. (2020). Cleaning the River Ganga: Impact of lockdown on water quality and future implications on river rejuvenation strategies. Science of The Total Environment, 743, 140756. https://doi.org/10.1016/j.scitotenv.2020.140756
He, G., Pan, Y., & Tanaka, T. (2020). The short-term impacts of COVID-19 lockdown on urban air pollution in China. Nature Sustainability. https://doi.org/10.1038/s41893-020-0581-y
Khan, R., Saxena, A., Shukla, S., Sekar, S., & Goel, P. (2021). Effect of COVID-19 lockdown on the water quality index of River Gomti, India, with potential hazard of faecal-oral transmission. Environmental Science and Pollution Research, 28(25), 33021–33029. https://doi.org/10.1007/s11356-021-13096-1
Le Quéré, C., Jackson, R. B., Jones, M. W., Smith, A. J. P., Abernethy, S., Andrew, R. M., et al. (2020). Temporary reduction in daily global CO2 emissions during the COVID-19 forced confinement. Nature Climate Change, 10(7), 647–653. https://doi.org/10.1038/s41558-020-0797-x
Muduli, P. R., Kumar, A., Kanuri, V. V., Mishra, D. R., Acharya, P., Saha, R., et al. (2021). Water quality assessment of the Ganges River during COVID-19 lockdown. International Journal of Environmental Science and Technology, 18(6), 1645–1652. https://doi.org/10.1007/s13762-021-03245-x
Venter, Z. S., Aunan, K., Chowdhury, S., & Lelieveld, J. (2020). COVID-19 lockdowns cause global air pollution declines. Proceedings of the National Academy of Sciences, 117(32), 18984. https://doi.org/10.1073/pnas.2006853117